In technical analysis, candlestick patterns are the visual representation offering insights regarding shifts in power between buyers and sellers. While many traders only focus on complex multi-candle formations, experienced market participants understand that a single candlestick can often be the first and most reliable indication of an imminent trend breakdown.
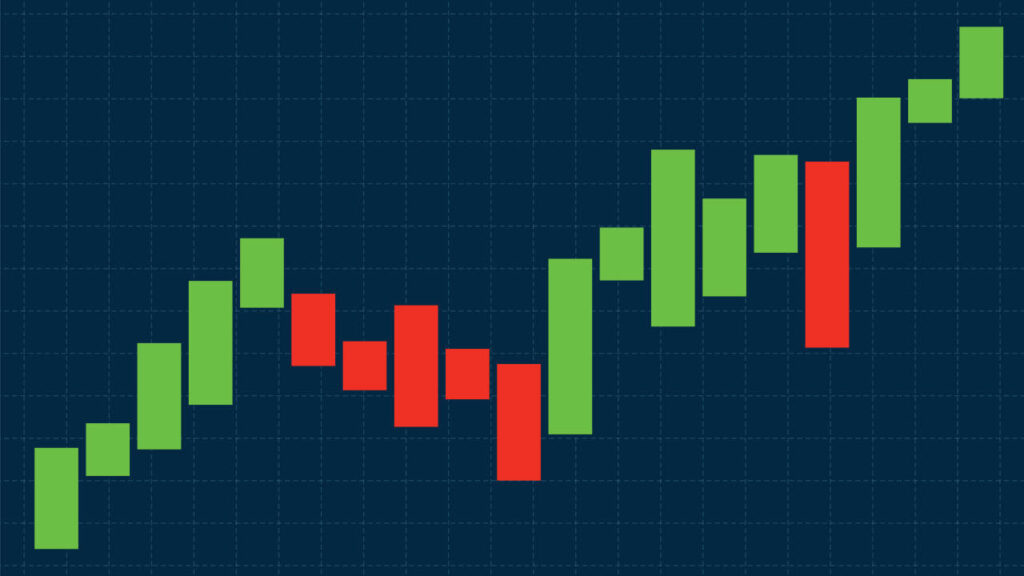
These individual candles form at critical moments and reflect important changes in market psychology that often precede reversals. In this blog, we will explore how one candlestick can indicate a trend breakdown.
How to interpret trend breakdown from a single candlestick?
A trend breakdown begins at the point when the balance between buyers and sellers shifts. Below are key ways in which single candlestick patterns warn of trend breakdown during stock analysis.
Sudden rejection through long wicks
A strong indication of a weakening trend is if there is a candle with a long wick in the direction of the prevailing trend. In an uptrend, the long upper wick indicates that the buyers had attempted to push prices higher but were unable to sustain the stock price at that price level.
By aggressively stepping in, sellers pushed the stock price close to the price before the close. This rejection is an indication that supply is coming in and demand is weakening, which is an early sign that the trend is losing strength.
Bearish engulfing pattern signals a shift in control
Among reversal signals, the bearish engulfing pattern is one of the most widely followed signals. It occurs when a large bearish candle completely engulfs the previous bullish candle during an uptrend.
This indicates that sellers have overpowered buyers in a single session. When it forms close to a resistance or after an extended move, it is a strong indication that bullish momentum is fading and a trend break may be approaching.
Small body candles after strong moves
Small-bodied candles (spinning tops or doji) are an indication that neither buyers nor sellers are in firm control. If such candles appear after an extended uptrend or downtrend, then they indicate hesitation and uncertainty.
While not a reversal in themselves, they often lead to bigger breakdown moves once one side is in control.
Strong opposite colour candle at key levels
A single strong candle moving against the trend can be an early breakdown signal, especially if it is close to a critical level such as resistance, support or trendline. For example, when a large red candle breaks below a rising trendline in an uptrend, it is a sign of shifting market sentiment.
It indicates that traders who were previously holding positions in support of the trend are now exiting positions.
Close beyond support or resistance
A candlestick that closes decisively beyond a key support or resistance level is often more significant. A breakdown candle that closes below support in an uptrend indicates that the buyers were unable to protect a key price zone.
This type of candle shows acceptance of lower prices, and there is a higher likelihood of a sustained trend reversal as opposed to a temporary pullback.
To Wrap Up
A trend does not necessarily end gradually. Often, the first sign of weakness can be seen with a single candlestick that shows changing market psychology. Long wicks, decisive opposite-colour candles and patterns, such as the bearish engulfing, can provide early warning signs of a trend breakdown.
While one candlestick should not be traded in isolation, it can serve as an important early signal for traders to tighten risk management, review positions, or wait for confirmation. Learning how to read these single candlestick patterns enables traders to act proactively instead of reacting after the trend has already reversed.